THE IMPACTAre we transforming clients' lives?
We also need to understand how our clients’ lives are changing and, as far as possible, understand the contribution our programs and services are making to those changes. This means establishing a clear vision of what transformation looks like and then building a baseline of data to assess what changes have occurred over time.
The Impact
Opportunity’s mission is to empower people living in poverty to transform their lives, their children’s futures and their communities. There are many factors that define poverty and the transformation we would like to see in our clients lives can have many different aspects. The diagram below shows these aspects through the example of Ragini, a typical client.
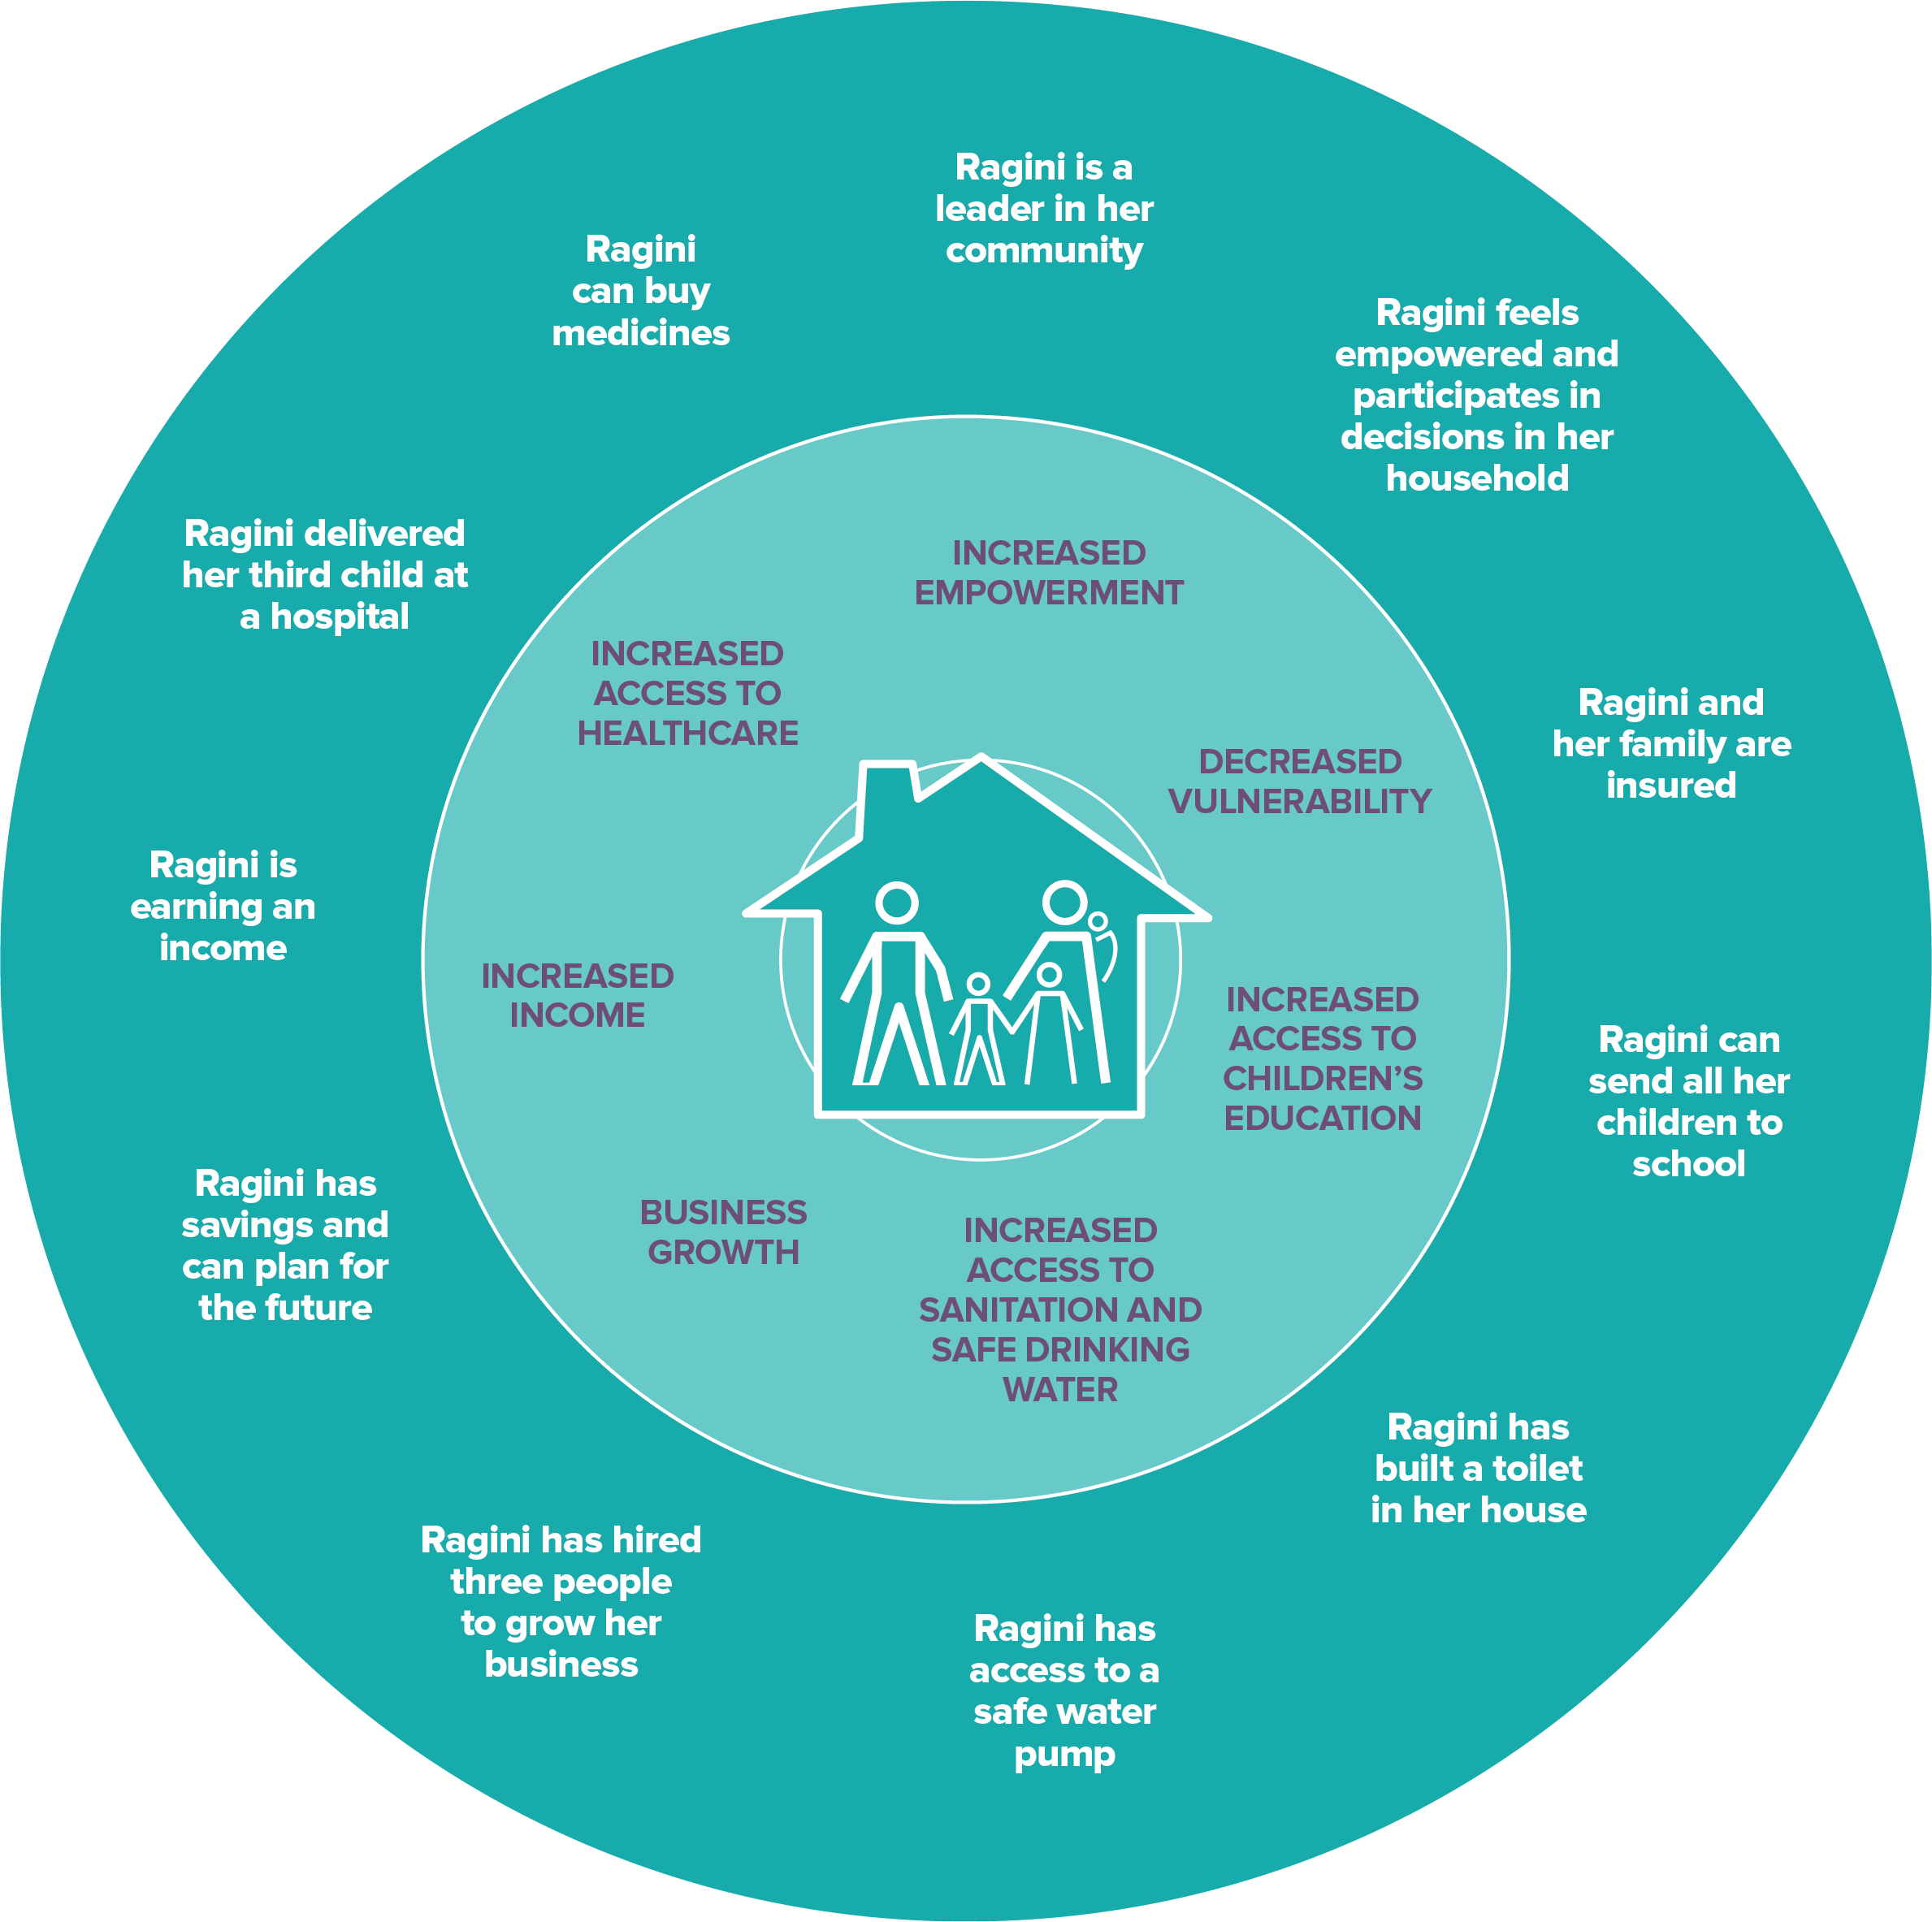
Transformation in the Lives of our Clients
If we are to report on our performance as an organisation, we need to be able to measure the transformation happening in our clients’ lives. The case of a single client can be illustrative, but we need data from across our clients and across our partners to fully report on how successful we are in achieving our mission.
Collecting transformation data is complex and expensive. It requires multiple surveys of large samples of clients over time. We are working with our partners to help them collect this data with some success though this is a work in progress. We are presenting data here from one of our leading partners in India, Cashpor who reported transformation against many of the poverty aspects illustrated above.
Cashpor has been surveying clients and collecting data on their poverty status. Every year, an impact assessment is carried out to determine the change in the lives of their clients.
Cashpor uses the Poverty Probability Index (PPI) tool to show the change in poverty status of their clients over time. Opportunity International has worked with many of our partners over the years to help them implement this tool. Using the PPI, Cashpor can show the change in the proportion of their clients living below the poverty line between the time they joined and the time they were surveyed in 2019.
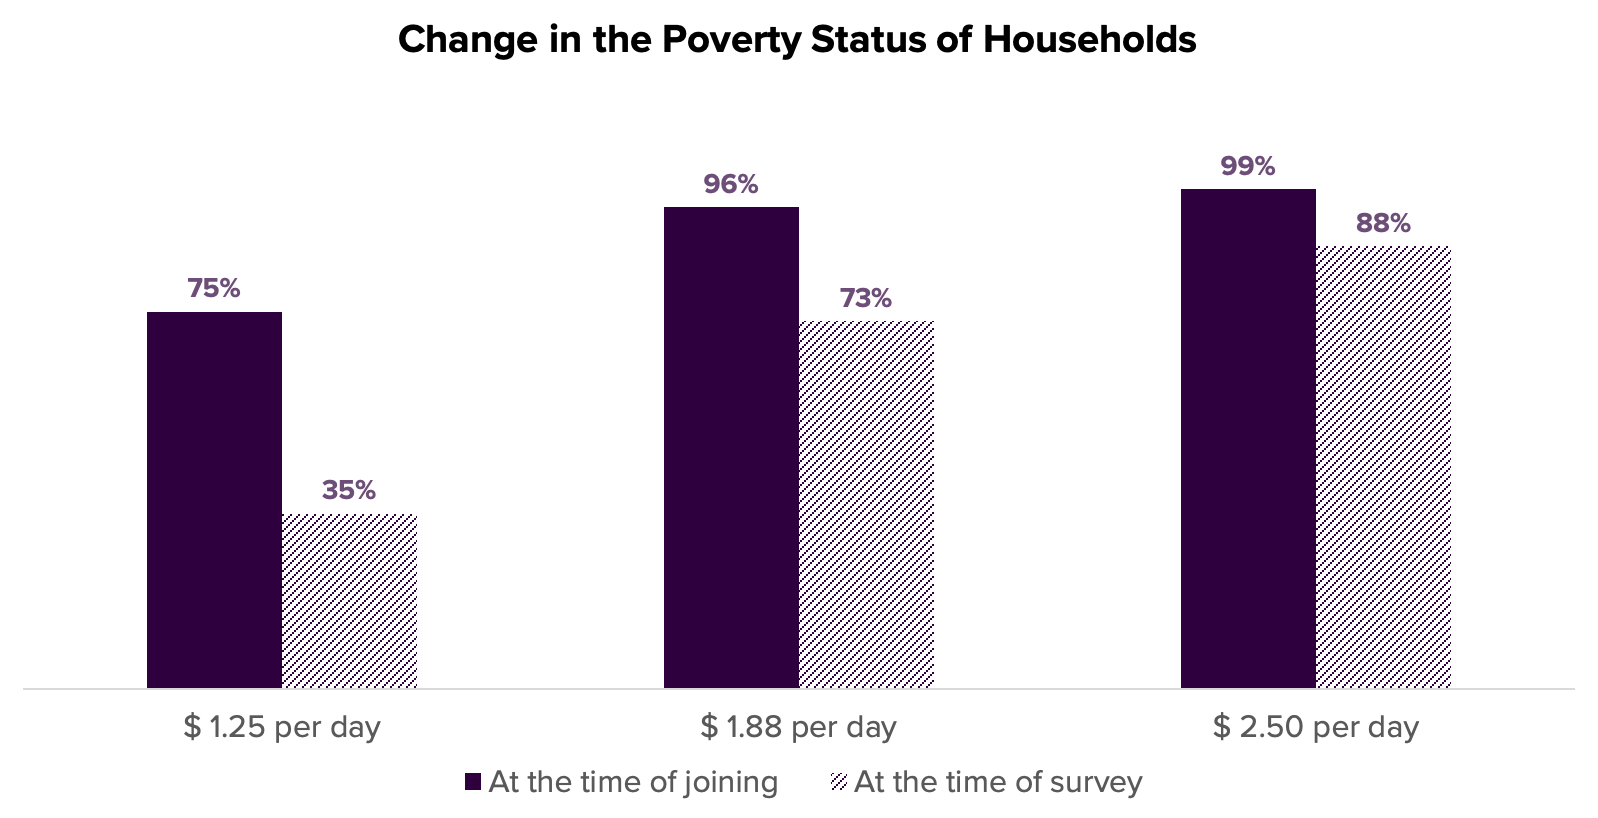
This chart shows that while 75% of clients surveyed were below the $1.25 per day poverty line when they joined the program, only 35% of the same clients were below the poverty line when surveyed again in 2019. Similarly, the % of clients below the national poverty line in India ($1.88 per day) fell from 96% to 73%, and the % of clients living on less than $2.50 per day fell from 99% to 88%.
Poverty is about more than just a lack of income. The following data from Cashpor’s survey in 2019 showed the other aspects of the clients’ lives.
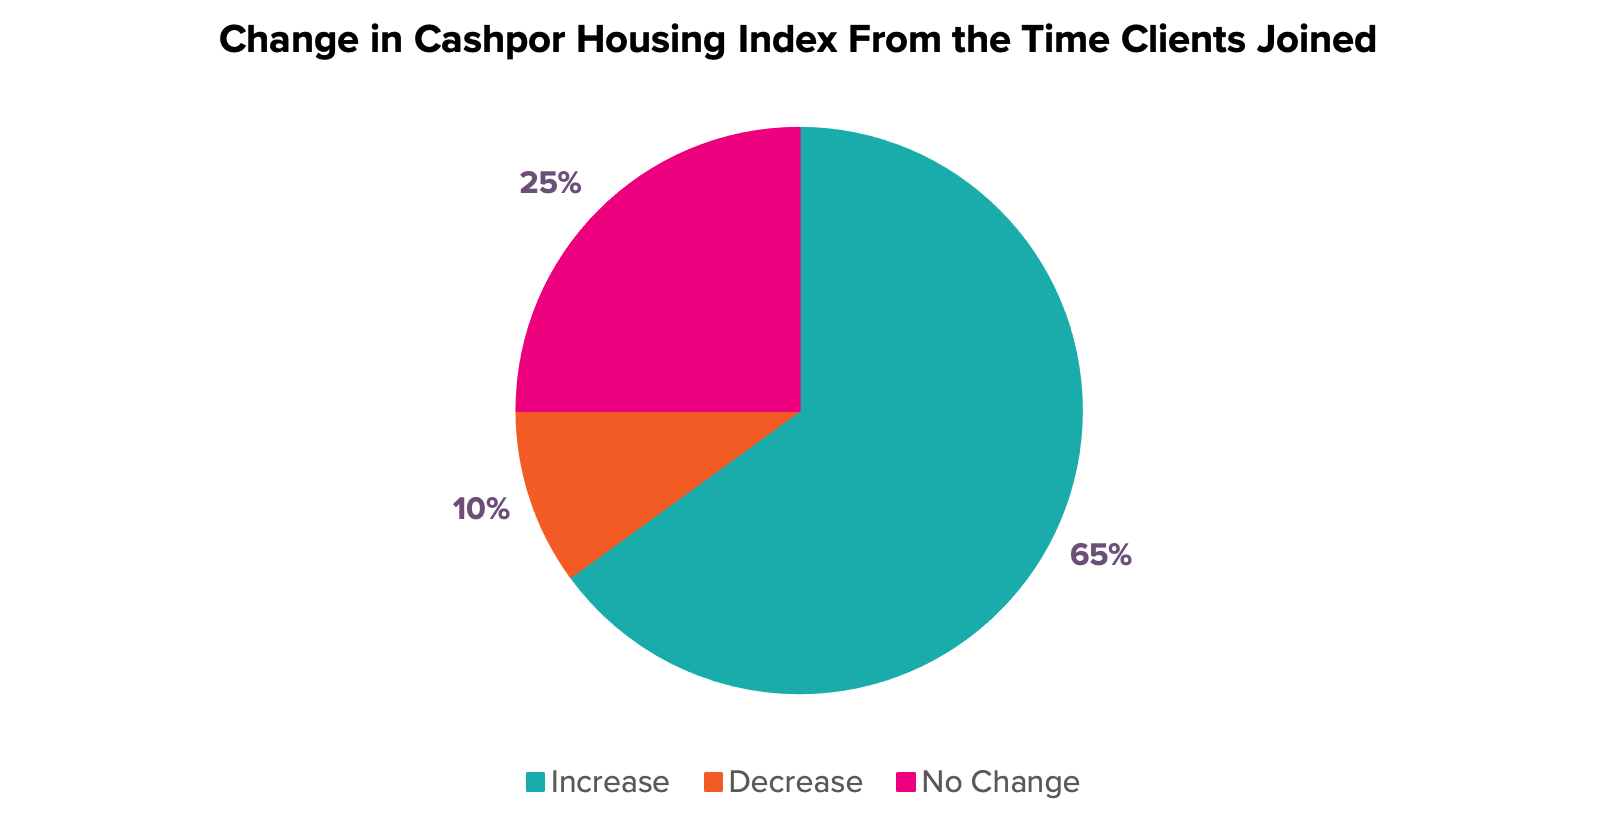
Cashpor collects data on the Cashpor Housing Index (CHI) to measure the clients’ living standards from a scale of 1 to 6, where 6 represents the best living conditions. Out of the surveyed clients who had a CHI score of less than 6 at the time of joining, 65% saw an improvement in their scores, while 10% and 25% of clients reported a decline and no change in scores respectively.
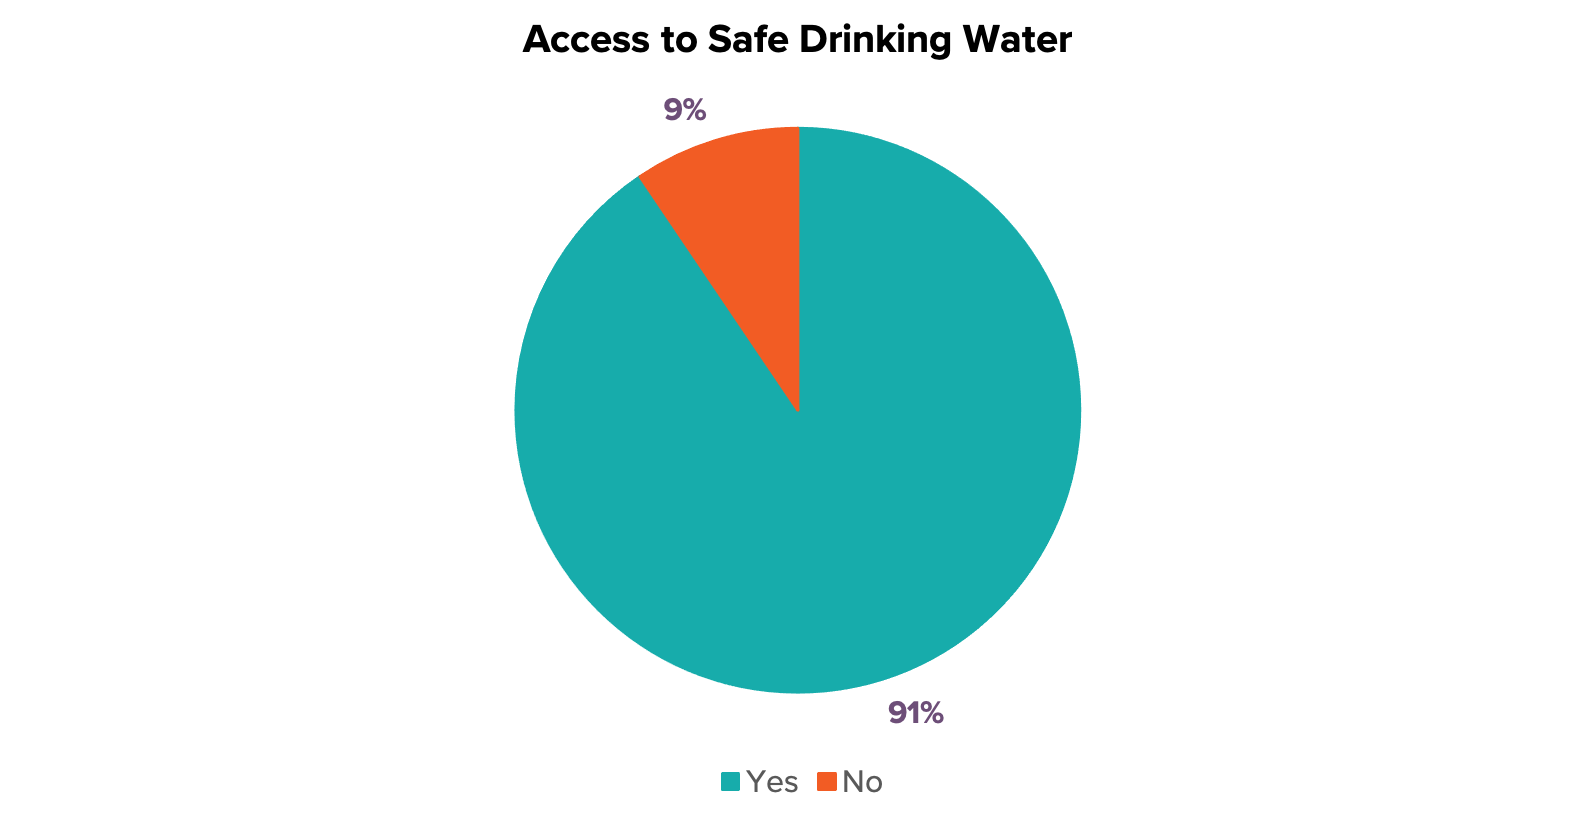
9 in 10 clients surveyed had access to safe drinking water in 2019.
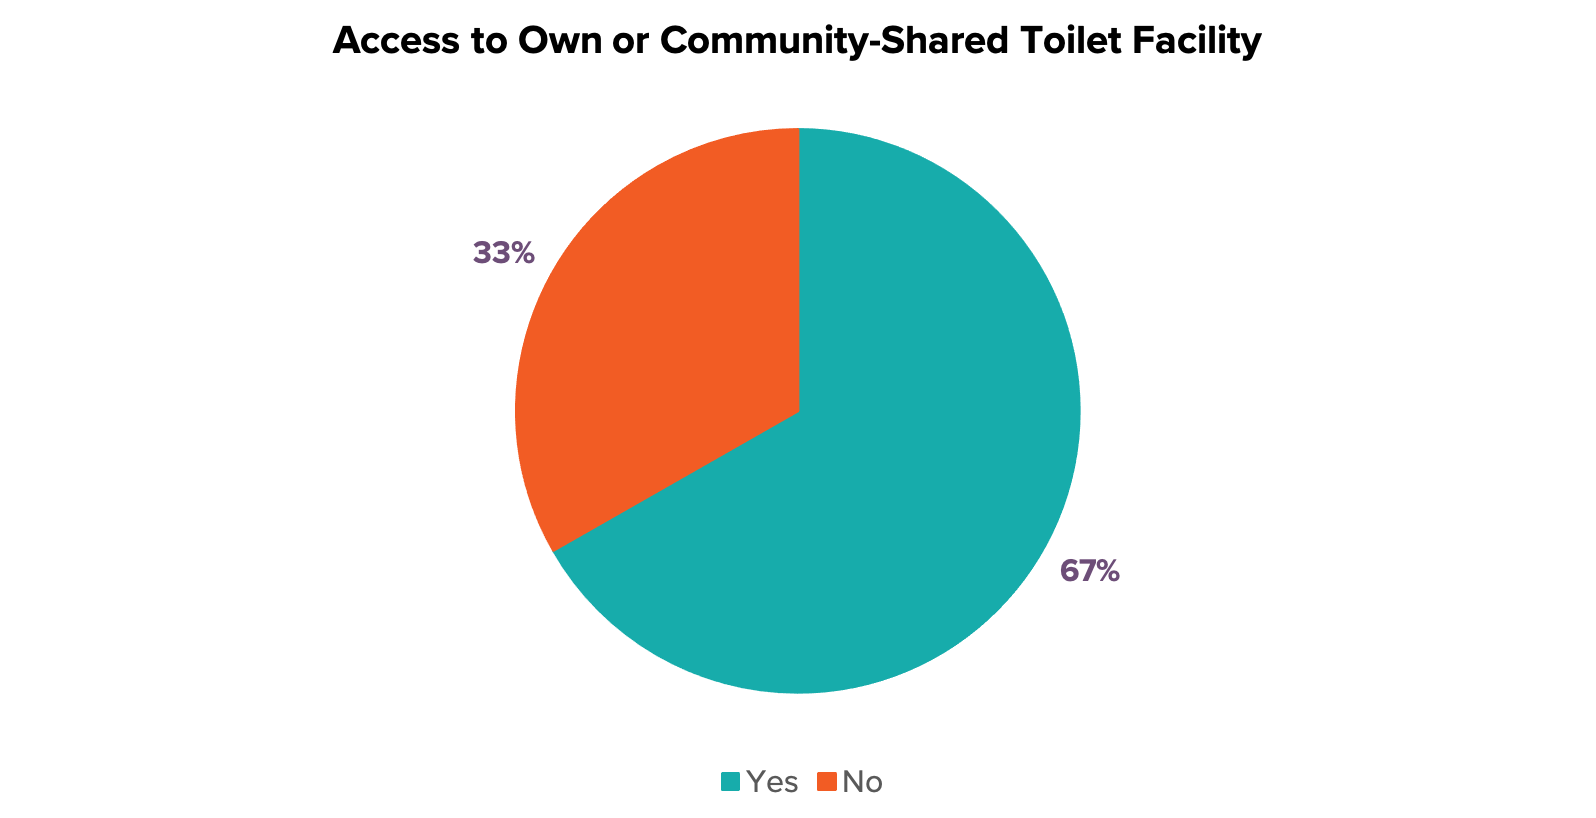
67% of the clients surveyed had access to their own or community-shared toilet facility in 2019.
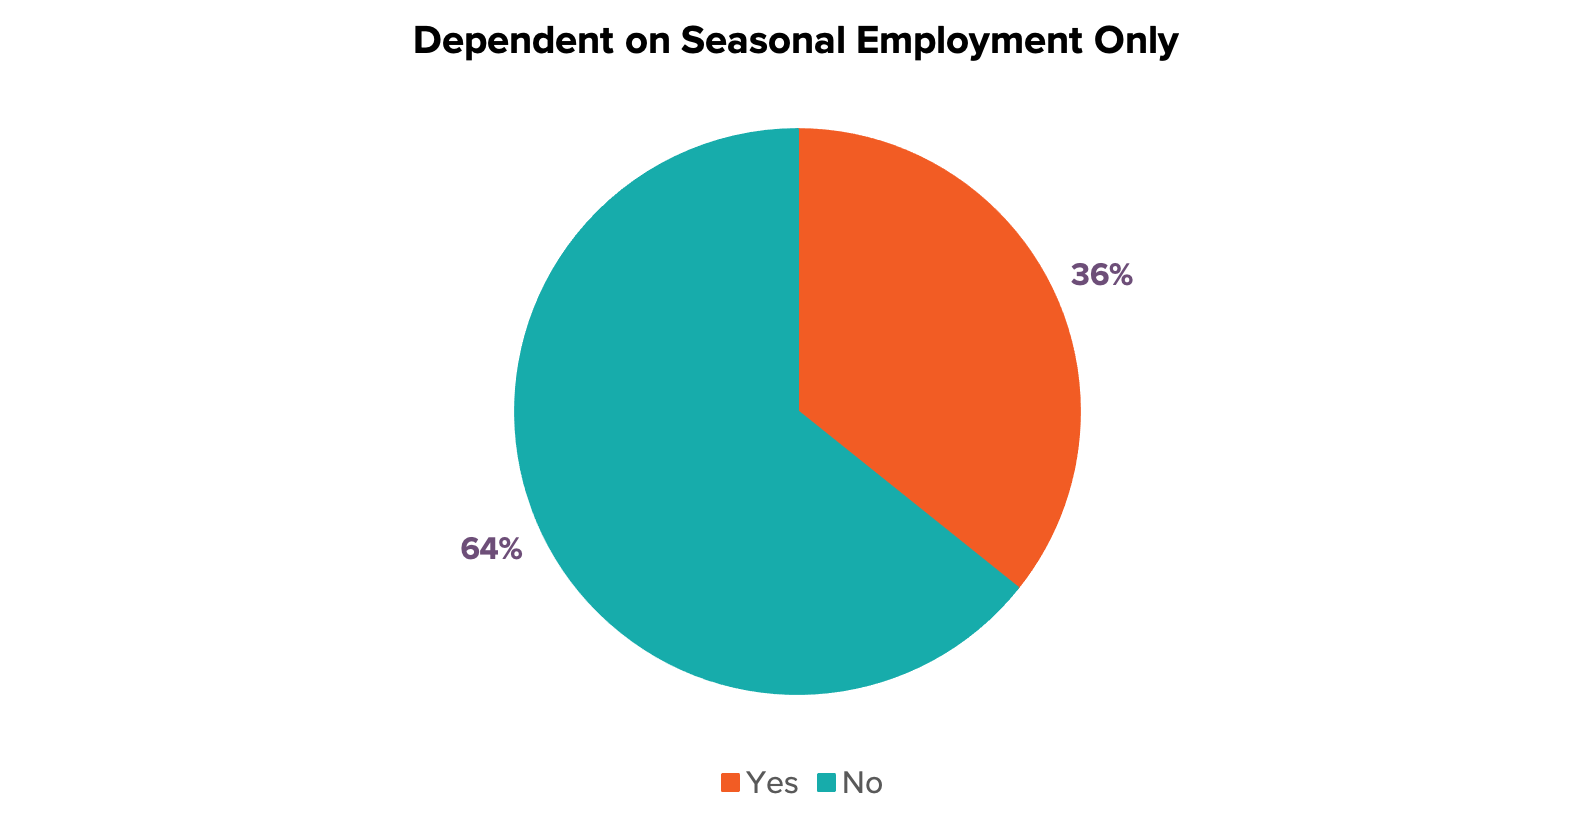
People who depend on seasonal employment is likely to live in poverty. In 2019, 64% of the clients surveyed do not depend on seasonal employment.
See here for more information on the impact across our partners in India.
CLIENT TRANSFORMATION AND THE IMPACT OF THE COVID-19 PANDEMIC
The Covid-19 pandemic has brought unprecedented challenges for all countries in the last 18 months, and has led to severe deprivations in the countries we work in. In June 2021, Opportunity International engaged 60_decibels – a research organisation specialising in Lean Data, customer centricity and impact measurement – to do an impact study to help us better understand who we are reaching, our impact on clients’ lives and the effect of Covid-19 on those clients and their communities.
60Db surveyed 197 clients of our Indonesian partner TLM and the results showed:
We are reaching the under-served:
- 44% of clients live on less than $3.20 per person per day, which is the recommended poverty line for Indonesia, suggesting that TLM is serving lower income clients than the Indonesia national average of 30%.
- Eight in ten clients are accessing loans for the first time
We see improvements in quality of life, increased income and increased savings:
- Roughly seven in ten clients reported at least some quality of life improvements because of the loan received from TLM.
- Sixty-three percent of clients report higher income and 48% report higher savings
Clients had a very positive experience with the partner:
- As part of the survey, 60Db used the Net Promoter Score (NPS), a gauge of client satisfaction and loyalty to assess how satisfied TLM’s clients are with the institution. TLM’s score of 84 compares very favourably with averages for South Asian companies (39) and the financial inclusion sector as a whole (49)
- Only 4% of clients report facing challenges in their engagement with TLM.
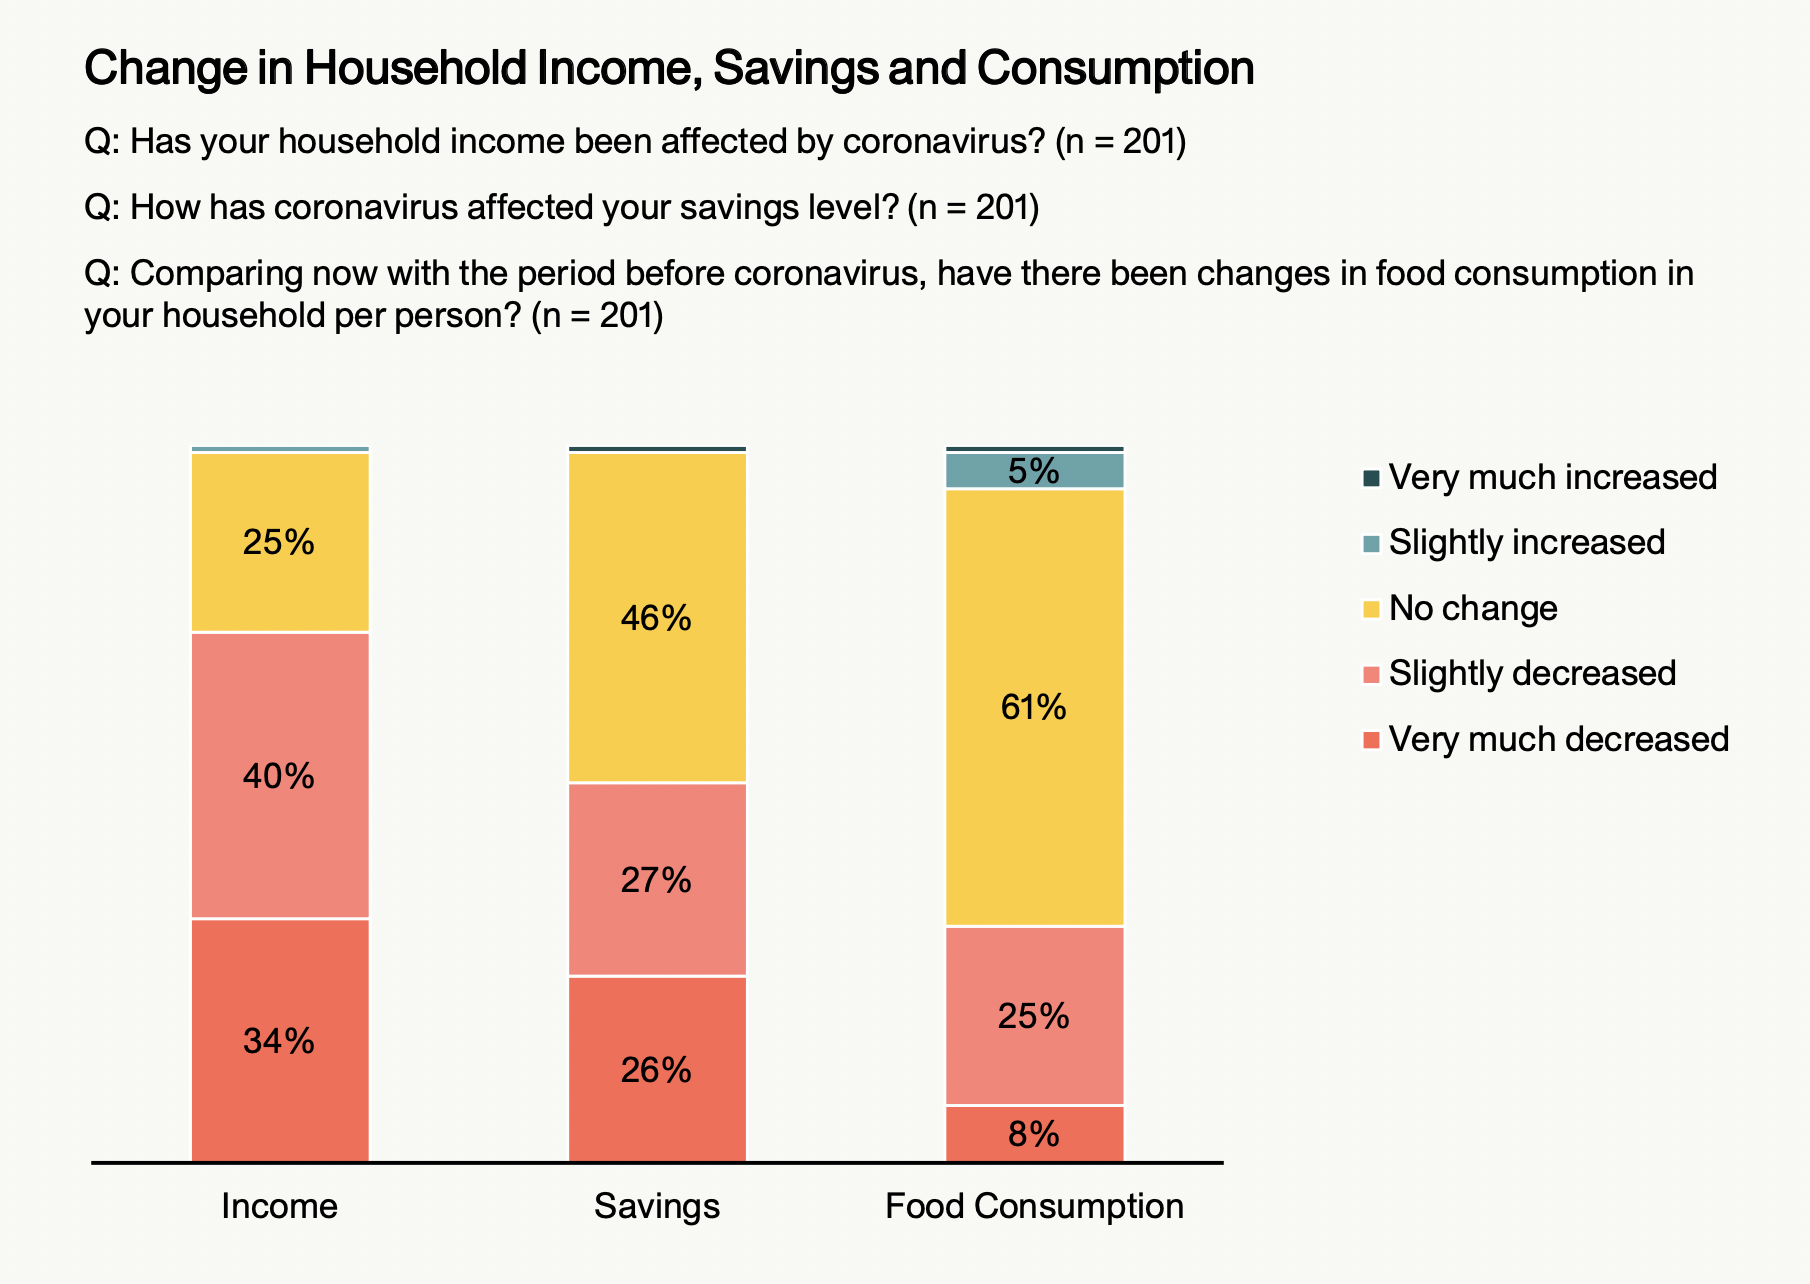
Covid-19 has had a significant impact on clients and increased their need for support:
- As a result of the pandemic, three quarters of clients report decreased income, over half of them have lower savings, and a third experienced reduced food consumption.
TLM are using the results of the survey to address specific requests for support from clients, to engage their staff through understanding the client experience, and to benchmark their current performance to assess the organisation’s progress over time.
Feedback Loops in Action: Meet Lovia From Ghana
Lovia is a farmer and mother of eight-month-old twins. She grows plantain, cocoa, palm oil, vegetables, maize, and pepper on her farm. Despite her hard work, Lovia continued to have poor harvests year after year.
Then, a friend told her she could learn about modern farming techniques and receive high quality seed and fertiliser through Opportunity.
In 2009 Lovia joined Opportunity International Savings and Loans (OISL) in Ghana and has since received access to credit, higher quality inputs such as seeds and fertiliser and education to help her improve her harvests and income.
This access has helped Lovia so much that she has now gone on to form the Bohyeba Farmer Group after she moved to Offinso, a neighbouring province. Now she and six other vegetable farmers are continuing to benefit with increased productivity and better incomes.
Lovia works hard and is driven by her desire to provide a secure future for her family. “I do my very best as a farmer. I was able to harvest two trucks of maize alone last year,” she says. Lovia now employs eight labourers to help her with everything from land preparation to harvesting. Her family owns the farmland.